Getting Started With Data Analysis Using SSAS Tabular Modeling In Excel - Part One
As we all know, SQL Server Analysis Service (SSAS) is an analytical data engine used in decision support and business analytics. It provides enterprise-grade semantic data models for business reports and client applications, such as Power BI, Excel, Reporting Services reports, and other data visualization tools.
We will try to implement the same workflow to show how we can do data analysis in SSAS. I have divided this in two parts,
- Getting started with data analysis using SSAS Tabular Modeling in Excel - Part I
We will see how we can create SSAS tabular model and setup measure, roles, calculated columns, hierarchies in tabular modeling. - Getting started with data analysis using SSAS Tabular Modeling in Excel - Part II
We will see how business users or we can do data analysis on SSAS tabular model in excel.
Let’s get started with this example.
Prerequisite
- SQL Server (SSMS and SSAS Tabular Model Configured) - here we have used SQL Server 2017 Developer Edition.
- SSDT (SQL Server Data Tools) - we have used SSDT for visual studio 2017
- MS EXCEL
NoteIt is very important to know the compatibility of SQL Server version that we will use. Please see this Microsoft Article for compatibility details.
Data
We will use “Adventure Works” Database to develop sample tabular model. We can download this database backup file from here.
In the below mentioned tables, we are going to create the tabular model.
Tables
|
Description
|
Customer
|
This table contains information related to customer. i.e. name,
address etc.
|
Person
|
This is more specific information related to Person
|
Product
|
This table contains Product details.
|
DemoSalesOrderHeaderSeed
|
This table contains Sales Order Header information. i.e. date,
customer info etc.
|
DemoSalesOrderDetailSeed
|
This table contains Sales
Order Detail.
|
Tabular Modeling
Now, we will create a Visual Studio Solution for the Tabular model.
- Go to the New Project.
- Select “Analysis Services Tabular Project” and named it “SSASTabularExample”.

It will open the Tabular model designer. Give “localhost” in “Workspace Server” and compatibility level 1400 as we are using SQL Server 2017. Click okay.

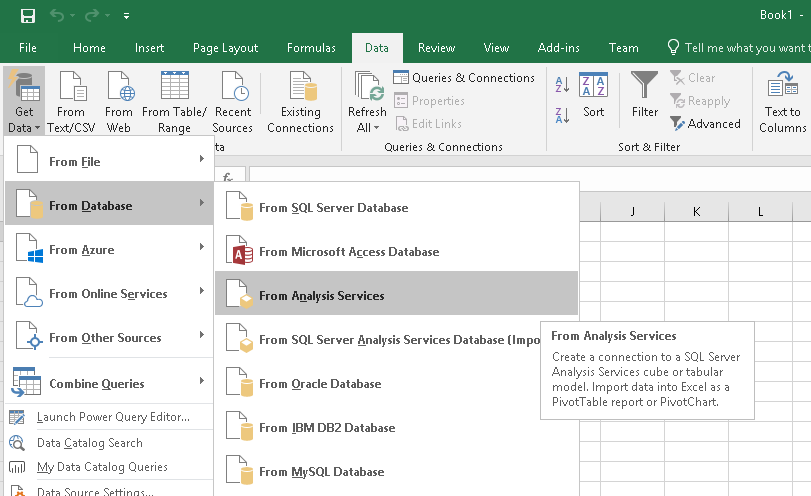
- Then, it will open a popup for load data from various sources. Here select “SQL Server Database”.
- Then, will need to provide server information and credentials.

We can see that it will provide the list of All SQL Server object tables, views, stored procedure etc. Here select required tables that I have already mentioned above and click on load button.

We can see data processing is successfully completed as in the below screenshot.

Right Click on Data Source in Tabular Model Explorer and view data that are in memory.

Relationship
Now we define one to many relationships between data. So, we can enable bi-directional cross filters in tabular model and no need to write custom DAX formula for filter data.
Click Diagram View in tabular model.

Right Click a table heading or column, and then click Create Relationship.

Please see this detail article about relationships by Microsoft.
Measures
A measure is a calculation on entire column using DAX formula for reporting purposes; i.e. product count, customer count, sum of product price etc.
Click Model View in tabular model and We will add below Measures in Model,
- Distinct Count of Customer:=DISTINCTCOUNT([CustomerID])
- Total of OrderQty:=SUM([OrderQty])
- Distinct Count of Product:=DISTINCTCOUNT([ProductID])
To add measures click on the column for which we want to create the measure, and then click the Column menu as below,

Please see this detail article about measures by Microsoft.
Hierarchies
Hierarchies are metadata that define relationships between two or more columns in a table and Hierarchies can appear separate from other columns in a reporting.
Here we create date hierarchy to show usage of hierarchies in tabular model so we have two more column month, year based date in “DemoSalesOrderHeaderSeed” table.

Click on Diagram View in a table window, right-click on a column, and then click Create Hierarchy.


Please see this detail article about hierarchy by Microsoft.
Roles
As we know, Roles define member permissions for a model. Members of the role can perform actions on the model as defined by the role permission. Here we define two roles, tabular user who has read permission on model and tabular admin who has admin permission on model.
Right Click on roles in Tabular Model Explorer and add roles on model.

Please see this detail article about roles by Microsoft.
Now we have successfully built Tabular Model and are ready to deploy it to server. There are few simple step for deployment as mentioned below.
Go to solution explorer, right click on model. Click on deploy. Let's connect analysis server and we see deployed tabular model as in the below screenshot,
Go to solution explorer, right click on model. Click on deploy. Let's connect analysis server and we see deployed tabular model as in the below screenshot,

Conclusion
In article, we have learned about how we can create SSAS tabular model and setup measure, roles, calculated columns, and hierarchies in tabular modeling.
In the next part, we will see how business users can do data analysis on SSAS tabular model in excel.
Hope you will love this article


Comments
Post a Comment